Spectro-Photometry validation
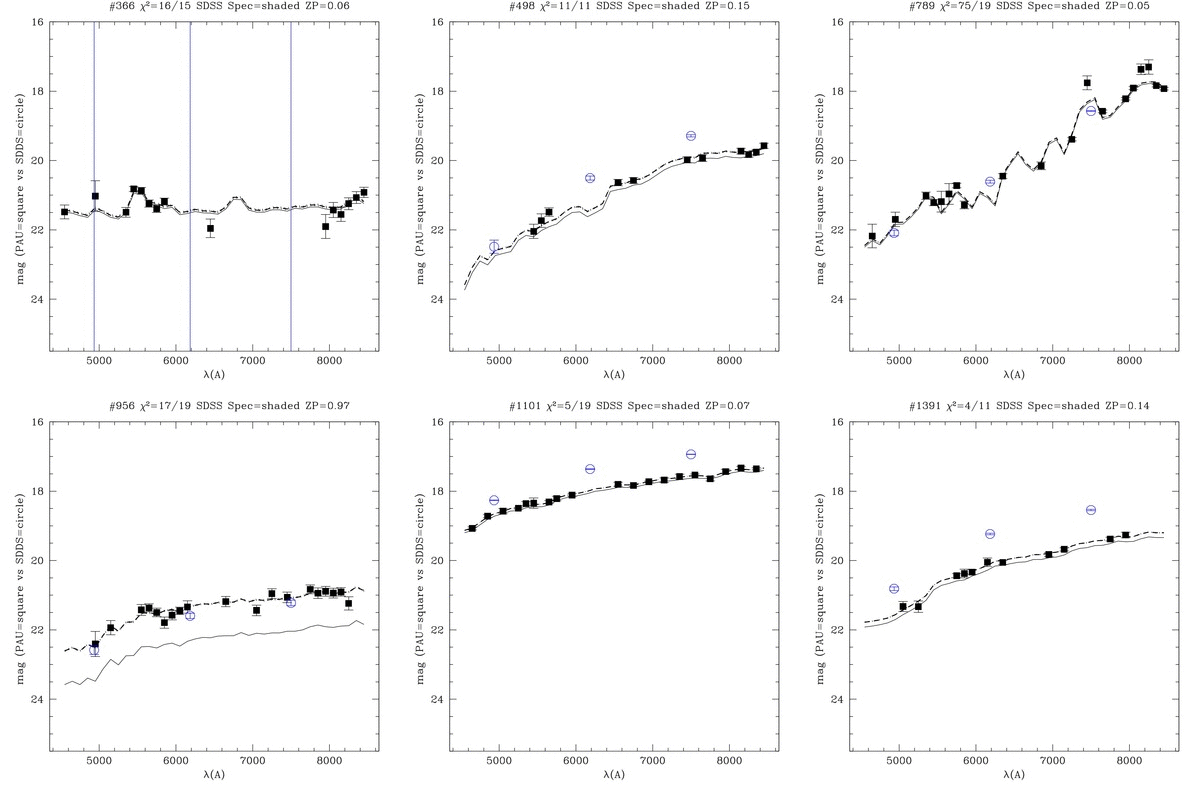
This is a sample sequence of (preliminary/incomplete) PAU data taken during last night of commissioning in June 2015. Here we compare the PAU Narrow Band measurements with SDSS Spectra to validate the camera and data reduction.
This a first pass. There is room for improvement/optimization in the data reduction processing/calibration to eliminate some remaining outliers and improve signal-to-noise. However the spectro-photometric system of PAU seems to behave as expected.

Blue Circles= SDSS g,r,i broad band (model magnitudes) Squares= PAU narrow bands (preliminary/incomplete) Continuous line= SDSS spec (raw, filtered to PAU narrow bands) Dashed line (with shaded errors)= SDSS spec scaled to match PAU.
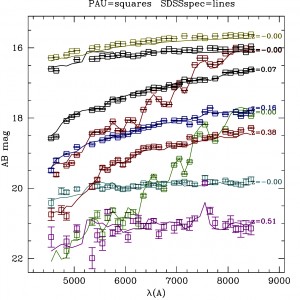
Some other examples using data from the PAU2016A observing run where we had more narrow band coverage:

Note that there is no adjustment in the plot above between the PAU fluxes and the SDSS measurements, each data set is calibrated separately and the plots shows a good agreement in both the relative and the absolute calibration.
Photometric Redshift performance

This shows Photo-z performance of PAUCam data over DEEP2 EGS region. We only include measurements in NB Tray 2+5 with photo-z Odds>0.3 (about 42% of the measured objects). Despite the fact that we are only using 16 NB we achieve the expected photo-z accuracy around the peak. Work in progress to reduce the number of outliers and to increase the completeness.
Depth statistics

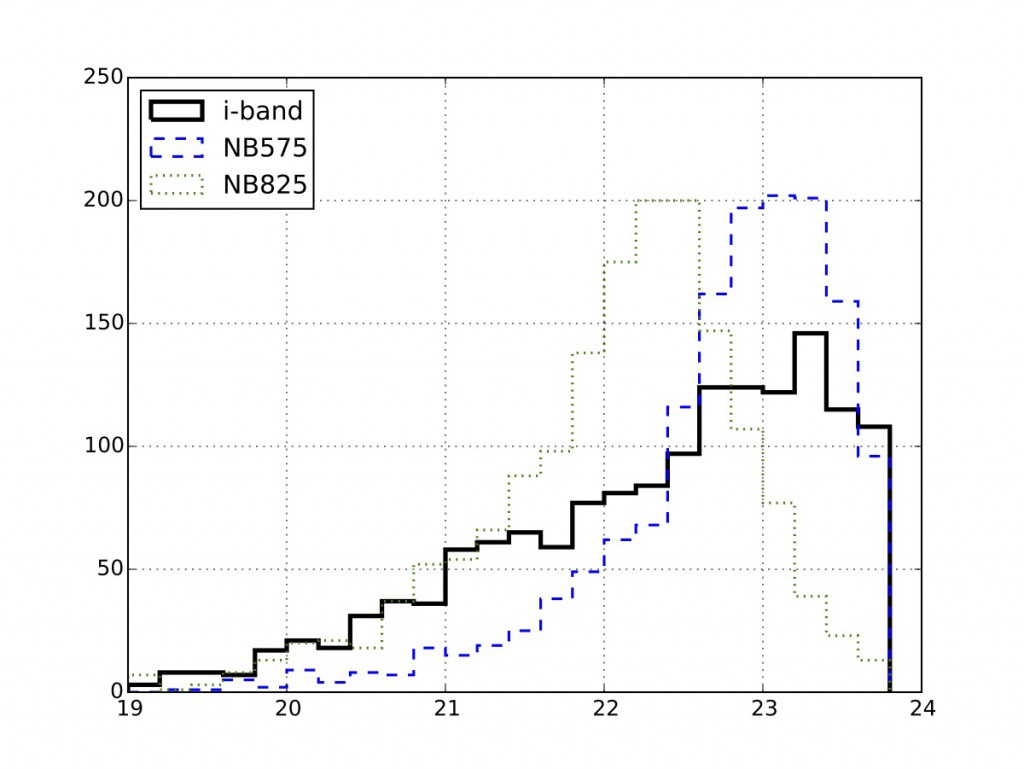
The distribution of BB (BroadBand) and NB (NarrowBand) magnitudes for all objects in the match with DEEP2 (without any Odds cut). We can see that we reach iAB~23 in BB and similar limits in NB (the reddest filers are brighter than the bluer ones as expected from SED and redshift distributions).
